What is the parabolic SAR indicator?
The parabolic SAR – or parabolic stop and reverse – is a technical indicator that is used to forecast potential reversals or continuations in an underlying market. A reversal can be a bullish market changing into a bearish market, or a bearish market changing into a bullish market, while continuations signify that a market will maintain its previous momentum. A trader can use the parabolic SAR to time their entry into a long or short position.
The indicator was first used by the same trader and analyst who created the relative strength index (RSI), J Welles Wilder Jr. He made the parabolic SAR with three primary functions: to highlight the current trend, to attempt to forecast a reversal in the prevailing trend, and to provide potential exit and entry signals during a reversal.
Parabolic SAR calculation
- Uptrend: PSAR = Prior PSAR + Prior AF (Prior EP – Prior PSAR)
- Downtrend: PSAR = Prior PSAR – Prior AF (Prior PSAR – Prior EP)
In this calculation, EP refers to the highest high for an uptrend and lowest low for a downtrend, updated each time a new EP is reached. The AF is a constant of 0.02, increasing by 0.02 each time a new EP is reached, with a maximum of 0.20.
However, many trading platforms – including the IG trading platform – enable you to overlay the parabolic SAR onto any price chart at the click of a button.
How to trade using the parabolic SAR
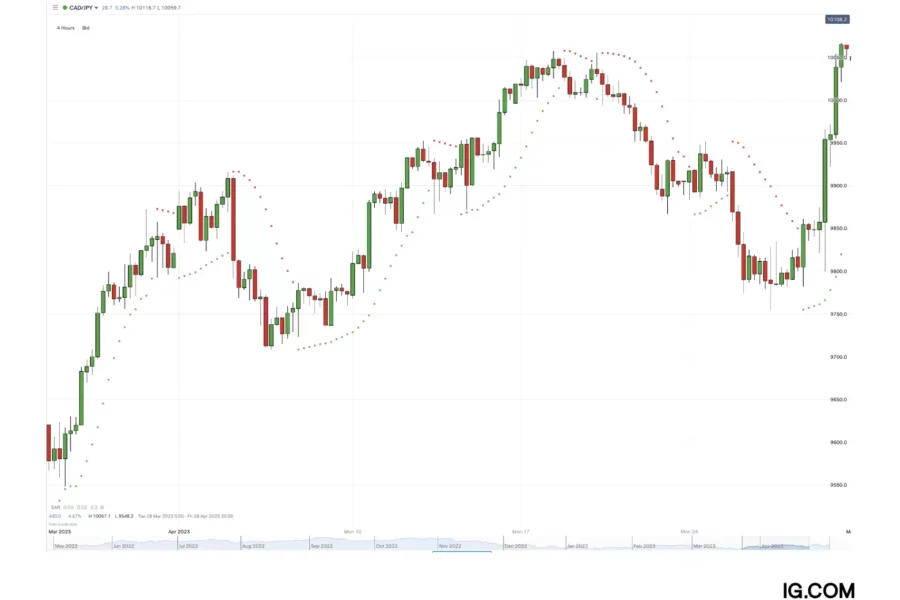
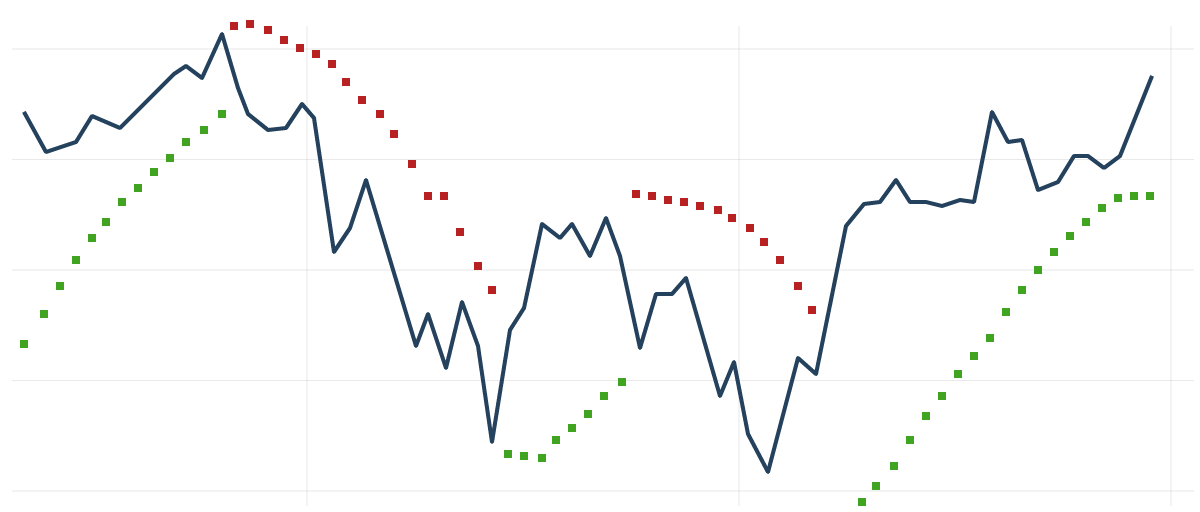
To trade using the parabolic SAR, you first need to understand what the different signals mean. The parabolic SAR will produce a series of dots – known as a parabolic line – above and below the price movements in an asset’s market chart. These dots will be either green or red.
When trading with the parabolic SAR, you would buy a market when the dots move below the current asset price and are green in colour. Alternatively, you would sell a market when the dots move above the current asset price and are red in colour.
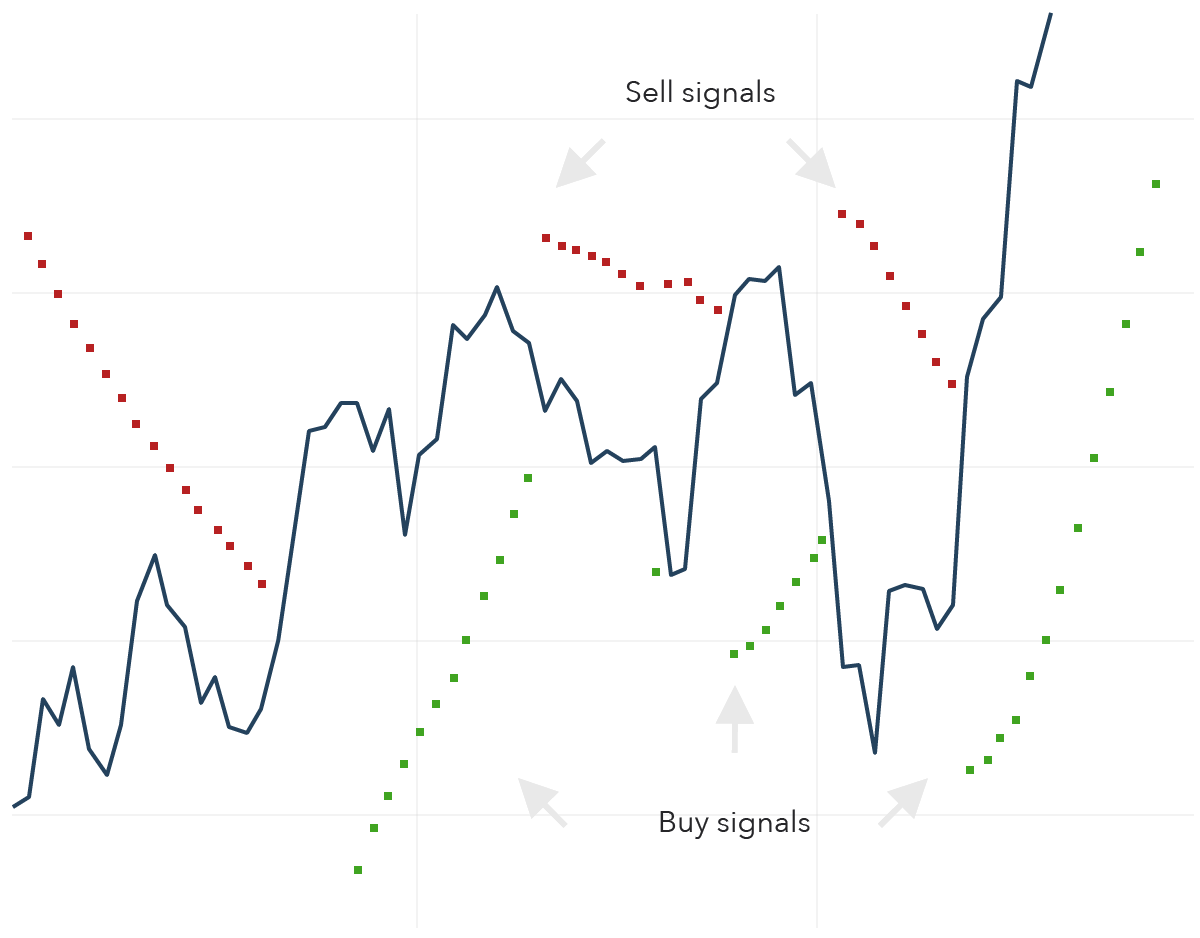
After a series of red dots – indicating a bearish market – traders will often consider the first green dot to be a signal for a reversal from the prevailing trend. This is the time at which many will choose to close their current short position if they had one, and open a long position on the same market.
For a red dot following a series of green dots, the opposite is true. The series of green dots shows that the market is currently bullish. But, the first red dot will often serve as a signal for a trader to close their current long position and open a short position on the same market as the trend is reversing from bullish to bearish.
That being said, the signals provided by the parabolic SAR indicator are not always completely accurate and you should carry out your own fundamental analysis and technical analysis of each market that you wish to trade before opening a position.
Parabolic SAR trading strategies
The parabolic SAR trading strategy is essentially a trend trading strategy. It is used to identify a particular trend, and it attempts to forecast trend continuations and potential trend reversals.
For example, if the parabolic line is green, you would follow the bullish trend and keep your long position open. If the parabolic line was red, you would follow the bearish trend and keep your short position open.
But, if a green parabolic line is interrupted by one or two red dots, you might think about closing your current long position and opening a short position. On the other hand, if a red parabolic line is interrupted by one or two green dots, you might think about closing your current short position and opening a long position.
You can use other trend trading technical indicators alongside the parabolic SAR to attempt to confirm the prevailing trend or any potential trend reversals. Examples of trend trading technical indicators include the moving average indicator, the relative strength index (RSI) and the average directional index (ADX).
Learn more about trend trading
Parabolic SAR summary
- The parabolic SAR is a technical indicator which traders use to attempt to forecast whether a prevailing trend will continue or reverse
- The indicator is based on parabolic lines, which are a series of coloured dots
- A series of green dots signals that the current trend is bullish
- A series of red dots signals that the current trend is bearish
- One or two red dots after a green parabolic line might signal a bearish reversal, and one or two green dots after a red parabolic line might signal a bullish reversal