What is Fibonacci retracement?
Fibonacci retracement denotes a type of technical analysis to identify the expected support and resistance levels of an asset.
It involves the use of several horizontal lines between a high and low point of an asset price. Fibonacci retracement levels are supposed to indicate several points where an asset’s price might halt or reverse its trend.
How does Fibonacci retracement work?
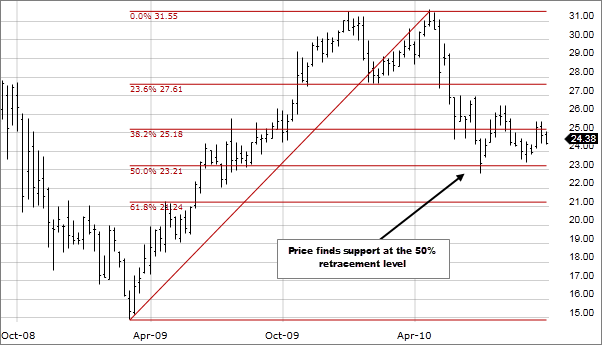
Fibonacci retracement levels are derived from the Fibonacci sequence 0, 1, 1, 2, 3, 5, 8, 13, 21, 34, 55, 89, 144, 233. Each new number is equal to the sum of the two preceding numbers. These ratios create the Fibonacci levels that you can use when trading: 23.6%, 38.2%, 61.8% and 78.6%. An unofficial Fibonacci retracement level often used for trading is 50%.
Imagine that a share price rises from £20 to £25. You’d draw a straight line between those two points before drawing four horizontal lines at the Fibonacci retracement levels. You’d then multiply the £5 difference in the share price by 0.236. Subtracting the answer, £1.18, from the asset’s £25 peak will give the 23.6% Fibonacci retracement level at £23.82.
You’ll then repeat this approach for the other Fibonacci retracement levels.
How to use Fibonacci retracement
Using Fibonacci retracement in day trading
You can use Fibonacci retracement as the basis for typical strategies to ensure a stable trading sequence. The levels realised in Fibonacci retracement can be used as markers for stop vs limit orders or to set price targets.
For example, imagine that you’re interested in Microsoft shares. Tracing a Fibonacci retracement line from a recent downward price movement, you set a limit order to buy shares (going long limit entry) at the 38.2% level, anticipating that the shares could rebound at this point.
Using a stop order to sell (going short stop entry), you could choose the 61.8% level, anticipating this as a point where the stock cloud breach its support.
Combining Fibonacci retracement with a MACD indicator
You can use a combination of the Fibonacci retracement and a moving average convergence divergence (MACD) indicator to confirm or question your assumptions on support and resistance levels.
A MACD indicator is a trend-following momentum indicator, meaning it looks at an asset’s price momentum to determine whether its trend is up or down. It uses two moving averages and a histogram.
You’d begin by using the Fibonacci retracement strategy, plotting a line between two price points and identifying the horizontal levels. You’d then track the MACD indicators to confirm your perceptions based on the Fibonacci levels.
This could include identifying bullish MACD crossovers or divergences to confirm a potential support level for a stock. Conversely, you could confirm a potential resistance level of a stock with bearish MACD crossovers or divergences to identify a selling opportunity.
Like with day trading, you can use this information to set price targets around bullish or bearish points.
Multiple timeframe strategy
The core approach to Fibonacci retracement is a fairly rudimentary form of technical analysis that can be made more complex using different methods.
You might wonder what timeframe is appropriate to create a Fibonacci sequence. If day trading, you’ll typically use a short timeframe to gauge support and resistance. But another strategy is to look at a chart over the long run.
Proponents of the multiple timeframe strategy say this smooths out volatility. While short-term analysis helps with entry and exit points, the multiple timeframe approach can smooth out shocks and give a wider view of a stock’s value. This makes it useful alongside fundamental analysis.
Fibonacci extensions are another way to make the sequence more complex and increase potential outcomes.
Fibonacci extensions
A Fibonacci extension adds extra price points to the typical Fibonacci retracement levels.
While Fibonacci retracements are popular for establishing the entry and exit points for a trade, extensions can be useful in establishing profit targets. Popular Fibonacci extension levels are 61.8%, 100%, 161.8%, 200% and 261.8%.
Like with retracements, extensions can be points where a price reversal may occur. They’re useful in areas where other methods of identifying an asset’s support or resistance don’t succeed.
Remember, trading with spread betting or CFDs comes with added risk attached to leverage. Your position will be opened at a fraction of the value of the total position size – but you can gain or lose money much faster than you might expect. You could even lose more than your initial deposit. When share dealing, you buy and own the shares, so you aren’t exposed to this risk. However, you’ll still need to keep in mind that past performance doesn’t guarantee future returns.
* Tax laws are subject to change and depend on individual circumstances. Tax law may differ in a jurisdiction other than the UK.
Pros and cons of using Fibonacci retracement
Pros
- Identify key potential levels – Fibonacci retracement is a good way to identify a stock’s potential resistance and support levels. When an asset breaches these levels, it can indicate either a buy or sell point
- Easy to use – Fibonacci retracement is a relatively easy strategy to pick up, given it has limited steps and a repeatable method
- Objective – Fibonacci is an objective technical indicator based on a mathematical ratio. You may be able to use Fibonacci levels to mitigate potential risk by avoiding relying on emotion
Cons
- Can be inaccurate – Fibonacci retracement alone can be inaccurate in identifying the correct support or resistance levels. Accordingly, using Fibonacci retracement alone heightens risks that you may have miscalculated the price
- Based on historical data – like any technical analysis, Fibonacci retracement relies entirely on historical data. Historical data is not necessarily an indicator of future price performance
- Subject to market volatility – Fibonacci retracement cannot take market volatility into account, which tends to wipe out previous support and resistance levels. Volatility makes it tough to reliably estimate possible future levels of support and resistance
Fibonacci retracement trading summed up
- Fibonacci retracement is a technical analysis tool for locating levels of support or resistance in an asset’s price
- It involves drawing a line between significant two points on a chart and calculating retracement levels based on percentages. It’s useful for identifying entry and exit points
- Fibonacci can be used in day trading strategies and alongside MACD indicators. They can be extended over time and alongside wider price points
- Fibonacci retracement can give an inaccurate portrayal of support and resistance, therefore it can be more useful when used as part of a wider trading strategy