What is the average true range indicator?
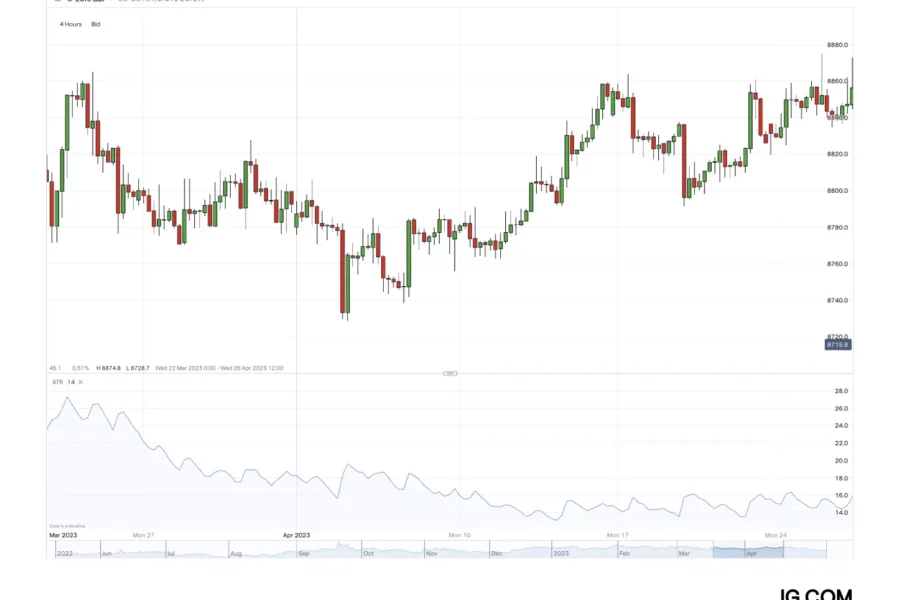
The average true range (ATR) indicator is one of a number of popular trading indicators, and it is used to track volatility in a given time period. It moves up or down according to whether an asset’s price movements are becoming more or less dramatic – with a higher ATR value representing greater volatility in the underlying market, and a lower ATR representing the opposite.
You can use the ATR to establish where to place a stop or limit order, as well as when you might want to open or close a trade. This is because, by tracking volatility in a given time frame, ATR shows when price movements might become more or less sporadic as volatility increases or decreases.
How to calculate the average true range
To calculate the average true range, you would first need to calculate the true range. You would do this by taking the largest of these three calculations:
- The current high minus the previous close
- The current low minus the previous close
- The current high minus the current low
You would repeat this throughout a specific time frame to achieve a moving average of a series of true ranges. A 14-period moving average is recommended as a basis from which to work out the average true range, usually over a 10- to 14-day period. For shorter time frames – hours for example – it’s recommended to use between two to 10 periods; for longer time frames – weeks or months – 20 to 50 periods are recommended.
For the table below, the figures have been used to calculate a 14-day ATR over a 10-day period. The true range for each day was calculated as described in the bullet points above.
The first true range value – taken for 1 August – is simply the current high minus the current low because the previous close cannot be used, and the first average true range – taken for 14 August – is an average of the 14 previous true ranges. After that, to achieve each subsequent average true range you would multiply the previous 14-day ATR by 13, add the most recent day’s true range and then divide the result by 14.
| High | Low | Close | True range | Average true range | |
| 1 August | 46.78 | 46.34 | 46.43 | 0.44 | |
| 2 August | 47.32 | 46.64 | 46.87 | 0.89 | |
| 3 August | 47.45 | 46.43 | 46.76 | 1.02 | |
| 4 August | 47.20 | 46.83 | 46.92 | 0.44 | |
| 5 August | 47.86 | 47.20 | 47.23 | 0.94 | |
| 6 August | 47.90 | 47.27 | 47.49 | 0.67 | |
| 7 August | 48.23 | 47.34 | 47.34 | 0.89 | |
| 8 August | 47.90 | 47.23 | 47.43 | 0.67 | |
| 9 August | 47.56 | 46.34 | 46.83 | 1.22 | |
| 10 August | 47.45 | 46.34 | 46.47 | 1.11 | |
| 11 August | 47.67 | 46.43 | 46.56 | 1.24 | |
| 12 August | 47.69 | 46.83 | 47.32 | 1.13 | |
| 13 August | 48.67 | 47.20 | 47.53 | 1.47 | |
| 14 August | 47.99 | 47.47 | 47.78 | 0.52 | 0.90 |
| 15 August | 48.32 | 47.47 | 47.63 | 0.85 | 0.90 |
| 16 August | 47.97 | 47.41 | 47.56 | 0.56 | 0.88 |
| 17 August | 47.98 | 47.21 | 47.33 | 0.77 | 0.87 |
| 18 August | 47.89 | 47.46 | 47.64 | 0.56 | 0.85 |
| 19 August | 48.34 | 47.55 | 47.87 | 0.79 | 0.84 |
| 20 August | 48.32 | 47.87 | 47.98 | 0.45 | 0.81 |
| 21 August | 48.39 | 47.56 | 47.84 | 0.83 | 0.82 |
| 22 August | 48.11 | 47.25 | 47.37 | 0.86 | 0.82 |
| 23 August | 48.02 | 47.67 | 47.79 | 0.65 | 0.81 |
From the ATR calculation, a trader can tell whether an asset is experiencing greater or lower volatility in a particular trading session. For this particular asset, the ATR remained below 1, and it moved within a narrow band of between 0.81 and 0.90 – meaning that it wasn’t experiencing high levels of volatility. As a result, this asset might be an attractive option for a trader who doesn’t have a large appetite for risk.